From Kiosk to Ruth E. Dickinson: Library Loans Across Branches 🏛️
Library borrowing remained fairly steady between 2023 and 2024, with a slight decrease from 1,139 loans to 1,111, a 2.5% drop. While total borrowing changed little, activity across individual branches showed noticeable differences.
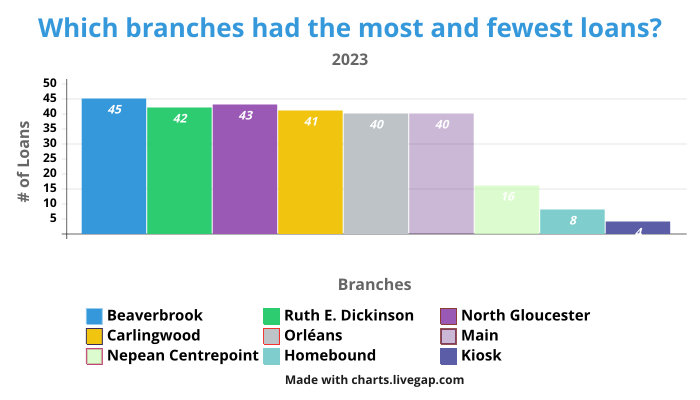
( Graph made by; Ana Da Silva)
High-usage branches like Beaverbrook, Ruth E. Dickinson, North Gloucester, and Greenboro consistently had the most loans, while smaller branches such as Kiosk, Homebound, and Fitzroy Harbour had the fewest. Some branches saw significant changes year over year — for example, Vanier more than doubled its loans from 17 in 2023 to 36 in 2024, making it the branch with the largest increase.
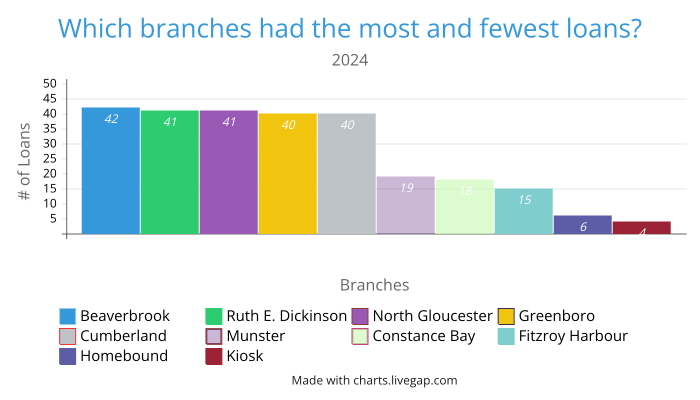
( Graph made by Ana Da Silva)
These charts clearly highlight which branches are most active and which have lower engagement, making it easy to see shifts in usage. Branch-level patterns like Vanier’s growth or Fitzroy Harbour’s decline provide a quick view of changing library demand across locations.
Overall, even with small changes in total loans, the variations across branches offer valuable insights for library management. The data shows where demand is growing or declining, which can help guide decisions about staffing, resource allocation, and branch support in the coming year.